Skip to content ↓
spring
Home
About Us
Welcome from our Co-CEOs
Equality Diversity and Inclusion
Our Central Team
Our Executive Team
Our Performance
Our Strategy
Our Vision and Values
Partnerships
Privacy Notices
Public and Employer's Liability
Sponsorship Opportunity
Spring Trust News
Spring Trust Policies
Spring Trust School Choir
Spring Trust Term Dates
Announcements
Our Schools
Elmstead Wood Primary School
Hayes Primary School
Leesons Primary School
Midfield Primary School
St Mary Cray Primary Academy
Teaching and Learning
Our Curriculum
Exemplification Resources
Professional Development
Leadership & Governance
Governance Opportunities
Members Information
Trust Reports and Documents
Trustees and Leadership Information
Trustees' Area
Facilities for Hire
Join Us
Schools and Academies
Staff Vacancies
Work Experience
Contact Us
Contact Us Form
Announcements
Congratulations to Midfield Primary School - 'Outstanding Provider' - Ofsted 2024
Home
»
About Us
»
Our Performance
»
Trust Combined End of Year Results 2023/2024
»
Home
»
About Us
»
Our Performance
»
Trust Combined End of Year Results 2023/2024
»
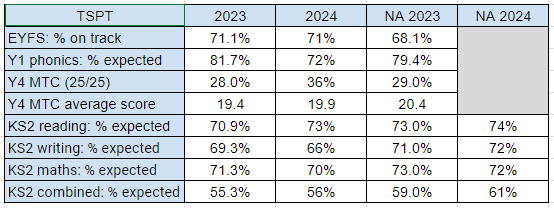
Trust Combined End of Year Results 2023/2024
In this section
Our Schools' Ofsted Performance
Our Schools' Ofsted Performance
Trust Combined End of Year Results 2023/2024
Trust Combined End of Year Results 2023/2024